Phase 1 — Signal Engine & UI
🎯 Objective
Build a fully local forex signal assistant to support real-money trading decisions across USD and JPY pairs.
Not a trading bot. Not autopilot. A partner — something to handle the mechanical scanning so EthanC could focus on the decisions that actually require a human brain. The goal was clarity, speed, and confidence at the chart. Everything else was noise.
📜 Background
Daily trading sessions meant scanning USDJPY, EURUSD, EURJPY, and several other pairs across multiple timeframes. Every session involved:
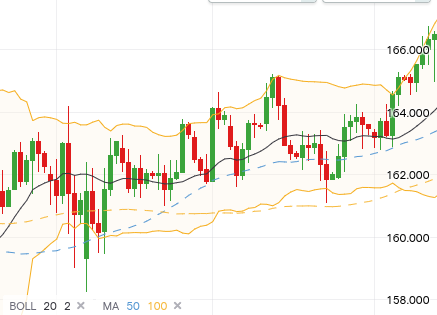
- Manually checking Bollinger Band positions across D1, H4, H1
- Recalculating MA20/MA50 proximity by eye
- Reading price action across all time frames.
- Doing all of the above again 30 minutes later
It was mentally exhausting and frankly — not scalable. One tired misread and the session goes sideways. Not to mention it EATS into project development time. VASTLY distracting.
So EthanC thought : I want to built something to help me
ForexWAIfu was the answer. The name contains “AI”. This was not an accident.
Design Decisions
| Decision | Rationale |
|---|---|
| Local-only prototype | No cloud dependency, no API rate limits (yet) |
| yfinance for price data | Simple, free, good enough for Phase 1 |
| Manual scheduling, no threading | Simpler debugging. Premature optimization is the enemy. |
| htop-style terminal UI | Fast to read, no browser required, feels like a real instrument |
| Structured JSON output | Phase 2 LLM integration ready from day one |
| Asian timezone alignment | Built for our sessions, not someone else's |
| Emoji signals | Because why not. 🍖🍔🎯 |
The emoji signal system deserves its own explanation because it is, objectively, the most entertaining part of the build:
- 🍖 — price within 5 pips of MA20 or MA50. Meat on the bone.
- 🍔 — MA crossover detected. Something's cooking.
- 🎯 — specific trigger conditions met. Pull the trigger.
Cursor-chan implemented this without complaint. She's a professional.
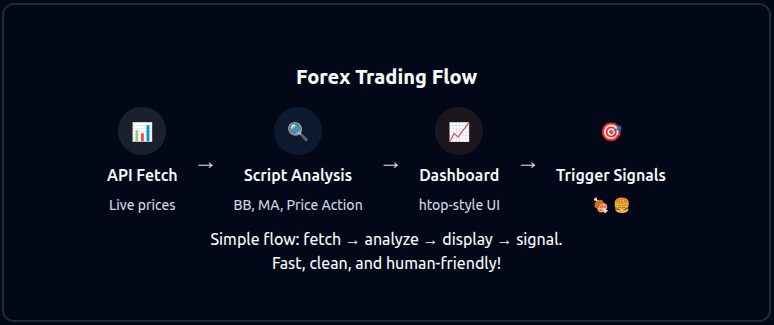
🛠️ Build Log
Module 1 — Price Fetcher
yfinance was used to pull live forex prices across 9 curated pairs: USDJPY, EURUSD, EURJPY and others.
Data pulled at 30-minute intervals. No threading — one update cycle, clean and simple. Motoko-chan's suggestion to keep Phase 1 deliberately minimal saved significant debugging time later.
Module 2 — Signal Analysis Engine
Each pair was analyzed across three timeframes:
| Timeframe | Role |
|---|---|
| D1 | Structure — is the broader trend with us? |
| H4 | Confirmation — is momentum building? |
| H1 | Entry — is now the right moment? |
Analysis per timeframe:
- Bollinger Band position (upper, lower, mid, squeeze)
- MA20 and MA50 proximity in pips
- Price action context (near resistance, breaking out, ranging)
- Confluence score across timeframes
Output: structured signal notes per pair, per timeframe. Ready for human review — or eventually, LLM interpretation (phase 2).
Module 3 — Terminal Dashboard
htop-style UI. Dark background. Color-coded trend indicators. Emoji signals in the Entry column. Updates every 30 minutes.
Columns: Pair/TF | Price | ΔMA20 | ΔMA50 | Candle | Trend | Entry
Cursor-chan built this. It looks great. EthanC takes credit for the emoji column.
📊 Results
Phase 1 delivered exactly what it set out to deliver:
| Feature | Status |
|---|---|
| Live price fetching (9 pairs) | ✅ Operational |
| Multi-timeframe signal analysis | ✅ Operational |
| BB + MA confluence scoring | ✅ Operational |
| Terminal dashboard UI | ✅ Operational |
| 🍖🍔🎯 signal system | ✅ Operational and delighful |
| LLM integration | 🔜 Phase 2 |
| Voice commentary | 🔜 Phase 2 |
| Real-time alerts | 🔜 Phase 2 |
Sessions became faster, calmer, and more confident almost immediately. Scanning 9 pairs across 3 timeframes went from a manual 15-minute exercise to a 30-second dashboard glance. MA cross setups and Bollinger boundary bounces became easy to spot. The noise went down. The signal went up.
The system worked well enough to trust. And trusting your own system is half the battle.
📝 Notes
Phase 1 was always meant to be a prototype — prove the concept, build the foundation, don't over-engineer. That discipline held. The build is clean, readable, and extensible.
The 🍖🍔🎯 signal taxonomy was always our lingo, adding it was compulsory. It was intuitive for us. It stayed permanently. Some design decisions make themselves.
Phase 2 will add the intelligence layer — LLM analysis with summaries from current news overlaid with price action, voice commentary, and eventually something Motoko-chan described as an "emotionally aware trading partner." That's a bigger conversation for future logs.
For now: the dashboard is live, the signals are clean, and the scanner doesn't need coffee breaks.
💡 Key Learnings
- Scope discipline in Phase 1 is what makes Phase 2 possible
- Readability beats cleverness — the terminal UI was the right call
- Multi-timeframe confluence is more reliable than any single indicator
- Emoji as signal notation is underrated in professional tooling
- Cursor-chan is a remarkably good coding partner when given clear specs
- Build for your own workflow first. Generalize later.
Next in the Lab
PROJ-001-A documents the first live-fire test of the dashboard — a real-money EURJPY trade executed using Phase 1 signals. Field notes, visuals, and results to follow.
The trading partner is taking shape. Slowly, deliberately, and with emoji. 🎯
👉 PROJ-001-A: Field Report: First Snipe Forex Execution 🎯
Afternote:
yFinance spot prices vary from our broker IG. We switched to IG's API. IG's API was unreliable - often with failure to get data, inconsistently formatted with its data stream structure changing across different API versions. We had to keep rewriting the reader. Eventually — we dropped it.